DSL Monitoring
Due to some trouble with my internet connection I built some tooling to monitor the connection. You may use it to gather data to talk to your provider. Or you can use it to get into a measure-change-measure debugging cycle. The latter approach helped me solving my problems (see this post for more details on my investigations & actions).
So I modified an existing package (see the fork link on Github) to make the monitoring completely running on my Synology. I chose that one, as it is always on and capable of running docker (I’ve got a Synology ‘+’ version). So in the end there is a Docker Compose file that will do anything that’s needed. For those of you who live on the edge and have it fully automated: there is a shell script as well that will even create all folders that are needed for the Docker images.
I am collecting data for
- up- and downstream DSL sync
- up- and downstream throughput / mesured bandwidth
- latency
- bandwidth
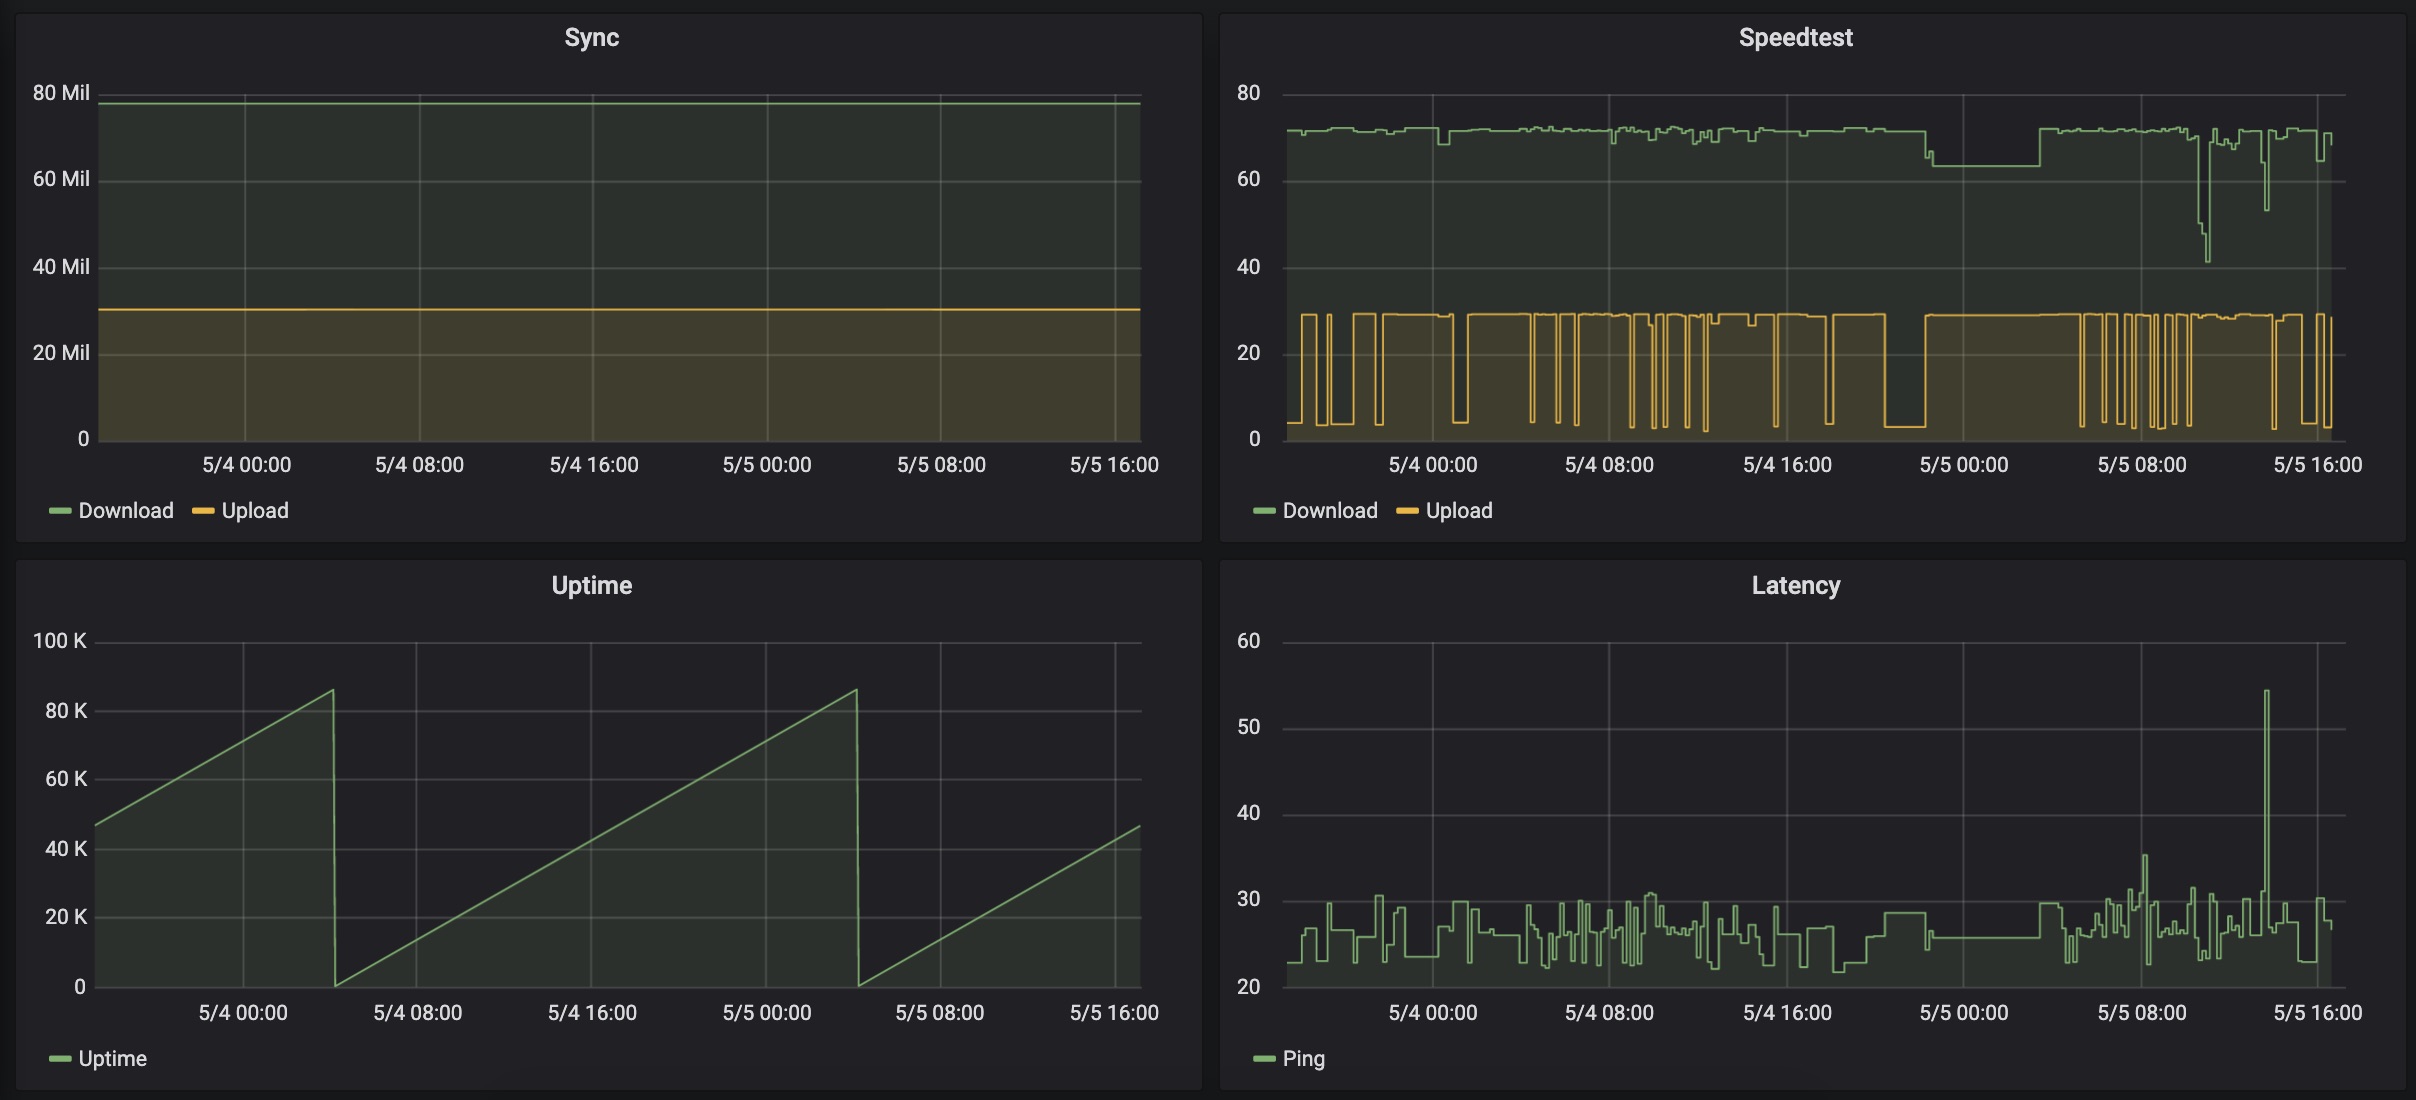
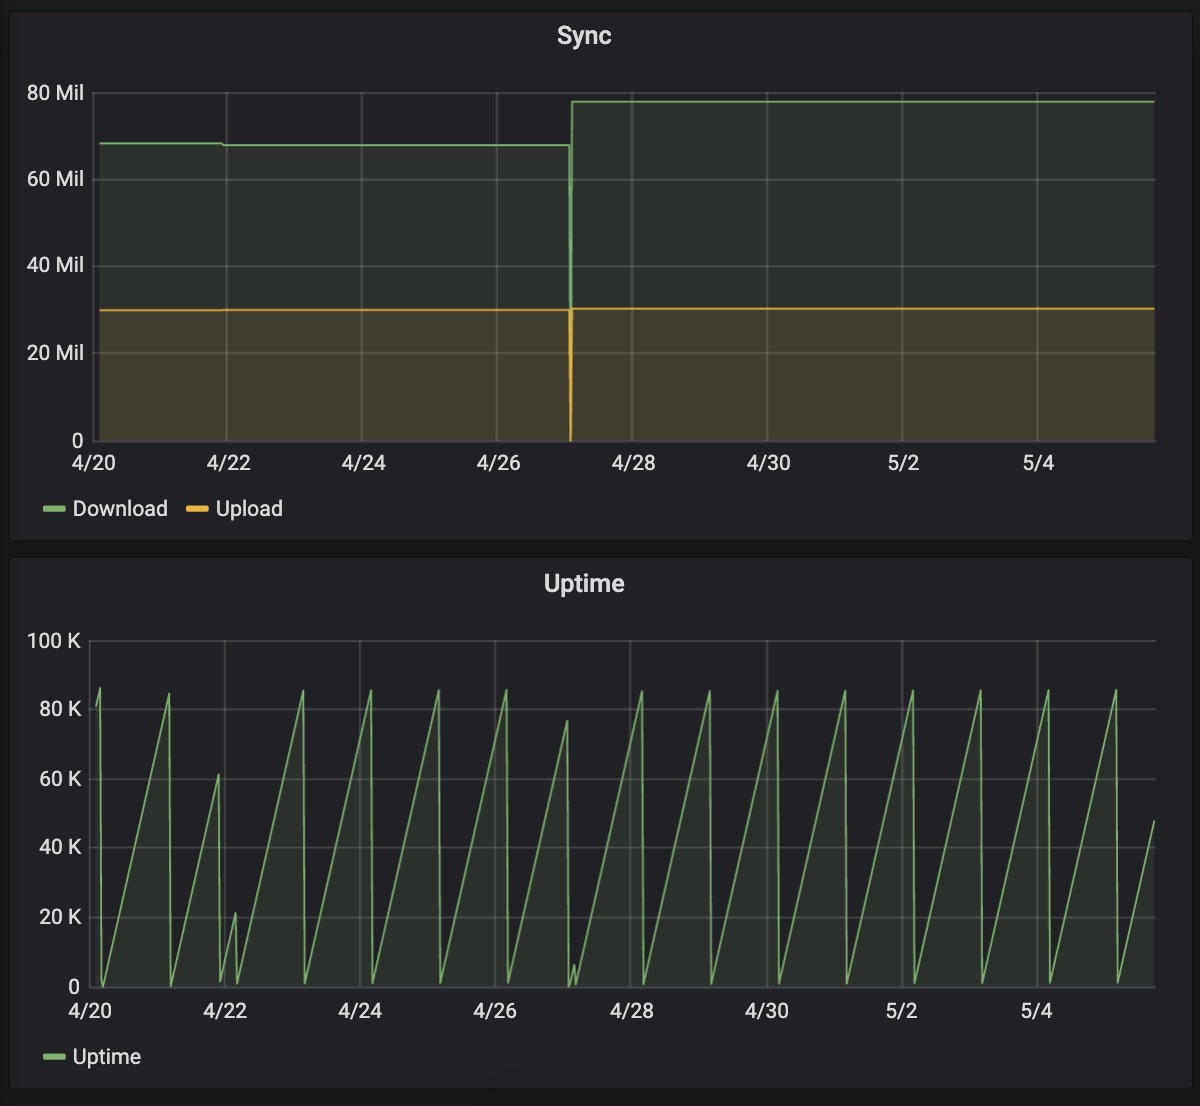
As you can see looging at the details: my last unplanned reconnect was on April 27th. Uptime is a growing counter. As german DSL lines are auto-reconnected by the provider every 24h you will see a regular saw teeth curve. Any additional small peak indicates a reconnect.
The whole thing will install:
- Prometheus
- a Fritzbox reader for its UPNP interface to get the sync rates and the uptime of the modem frequently, exposing them as a Prometheus exporter
- a speed test the check the resulting network speed. First I used an existing speed test (you will find it commented in the Docker Compose file), but it did not deliver accurate numbers, though it was very stable. I took the reference library of the Measurement Labs and modified it to be used as a of Prometheus exporter. The M-Lab speed test is the test you run when you type “speed test” into Google. Most of the time it delivers accurate numbers, though there are some wrong measurements there, depending on the server that is chosen.
- Grafana to visualize everything.
After the installation you should be able to connect to Grafana running on your Synology where you should be able to configure your graphs.
See https://github.com/wlbr/synology-prometheus for details.